A star is a giant ball of self-luminous gas with physical properties such as mass, temperature and radius. Also of interest to astronomers is the distance from the star to Earth. The closest Ś and most-studied Ś star is, of course, our own Sun.
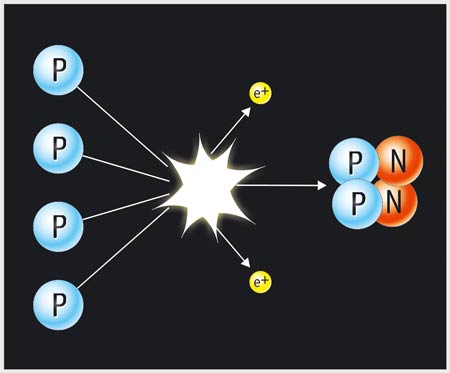
The light emitted by most stars is a by-product of the thermonuclear fusion process in the stars inner core. A normal sun-like star is composed of about 74% hydrogen and 25% helium, with the remaining 1% being a mixture of heavier elements. The most common fusion process in sun-like stars is Ĺhydrogen burningĺ, where four hydrogen nuclei fuse into one helium nucleus. The process occurs over several stages, illustrated in Fig. 2. In the first step of the process two protons fuse to form deuterium, a form of heavy hydrogen. This is a very rare event, even at the starĺs dense core, where the temperature is a few million degrees. This is why all sun-like stars do not explode in a wild runaway reaction when starting the fusion process, but remain in this stable phase of the starĺs life for several billion years. While the star is stable its surface temperature, radius and luminosity are nearly constant. The nuclear reactions at the core generate just enough energy to keep a balance between the outward thermal pressure and the inward gravitational forces.
The mass of a helium atom is only 99.3% of the mass of the four original hydrogen nuclei. The fusion process converts the residual 0.7% of mass into energy Ś mostly light. The amount of energy can be calculated from Einsteinĺs famous equation, E = Mc2. As c2 is a large number, this means that even a small amount of matter can be converted into an awesome amount of energy. The residual 0.7% of the mass of four hydrogen nuclei involved in a single reaction may seem tiny, but when the total number of reactions involved in the fusion process is considered, there is a substantial total mass (and thus energy) involved.
|
|
Figure 2: Hydrogen burning The simplest form of energy Ĺproductionĺ in stars takes place by the fusion of four hydrogen nuclei into one helium nucleus. The process has several steps, but the overall result is shown here. |
The term Ĺstar clustersĺ is used for two different types of groups of stars: open star clusters and globular star clusters. Open star clusters are loose collections of a hundred to a few thousand relatively young stars. These are typically a few hundred million years old, a fraction of the few billion years that stars take to evolve. These clusters are found in the disc of our Galaxy, the Milky Way and often contain clouds of gas and dust where new stars form. The typical diameter of an open star cluster is about 30 lightyears (10 parsecs).
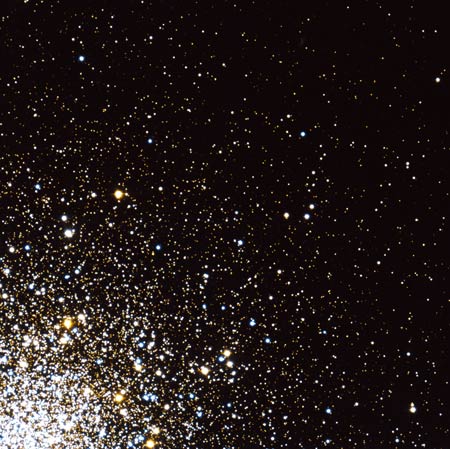
A few hundred compact, spherical clusters called globular clusters exist in the disc and halo of our Milky Way and are gravitationally bound to our Galaxy. Each globular cluster consists of a spherical group of up to a million stars and is typically 100 light-years across. Most of the globular clusters are very old and most likely predate the formation of the Galaxy that took place about 12 billion years ago when the majority of the proto-galactic material settled into the disc.
Many globular clusters have probably been destroyed over the past billions of years by repeat-ed collisions and interactions with each other or with the Milky Way. The surviving globular clusters are older than any other structures in our Milky Way. The astrophysical study of globular clusters
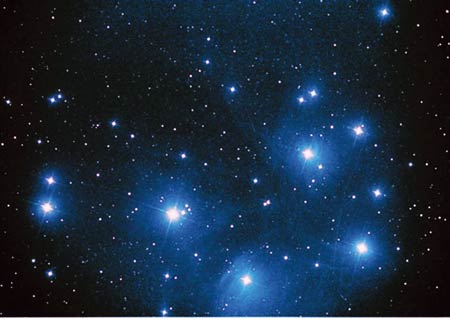 |
Figure 3: The Pleiades (Messier 45) in the constellation of Taurus This is one of the most famous star clusters in the sky. The Pleiades can be seen with the naked eye from even the most light-polluted cities. It is one of the brightest and nearest open clusters. The Pleiades cluster contains more than 3000 stars, is about 400 light-years away and only 13 light-years across (courtesy Bruno Stampfer and Rainer Eisendle). |
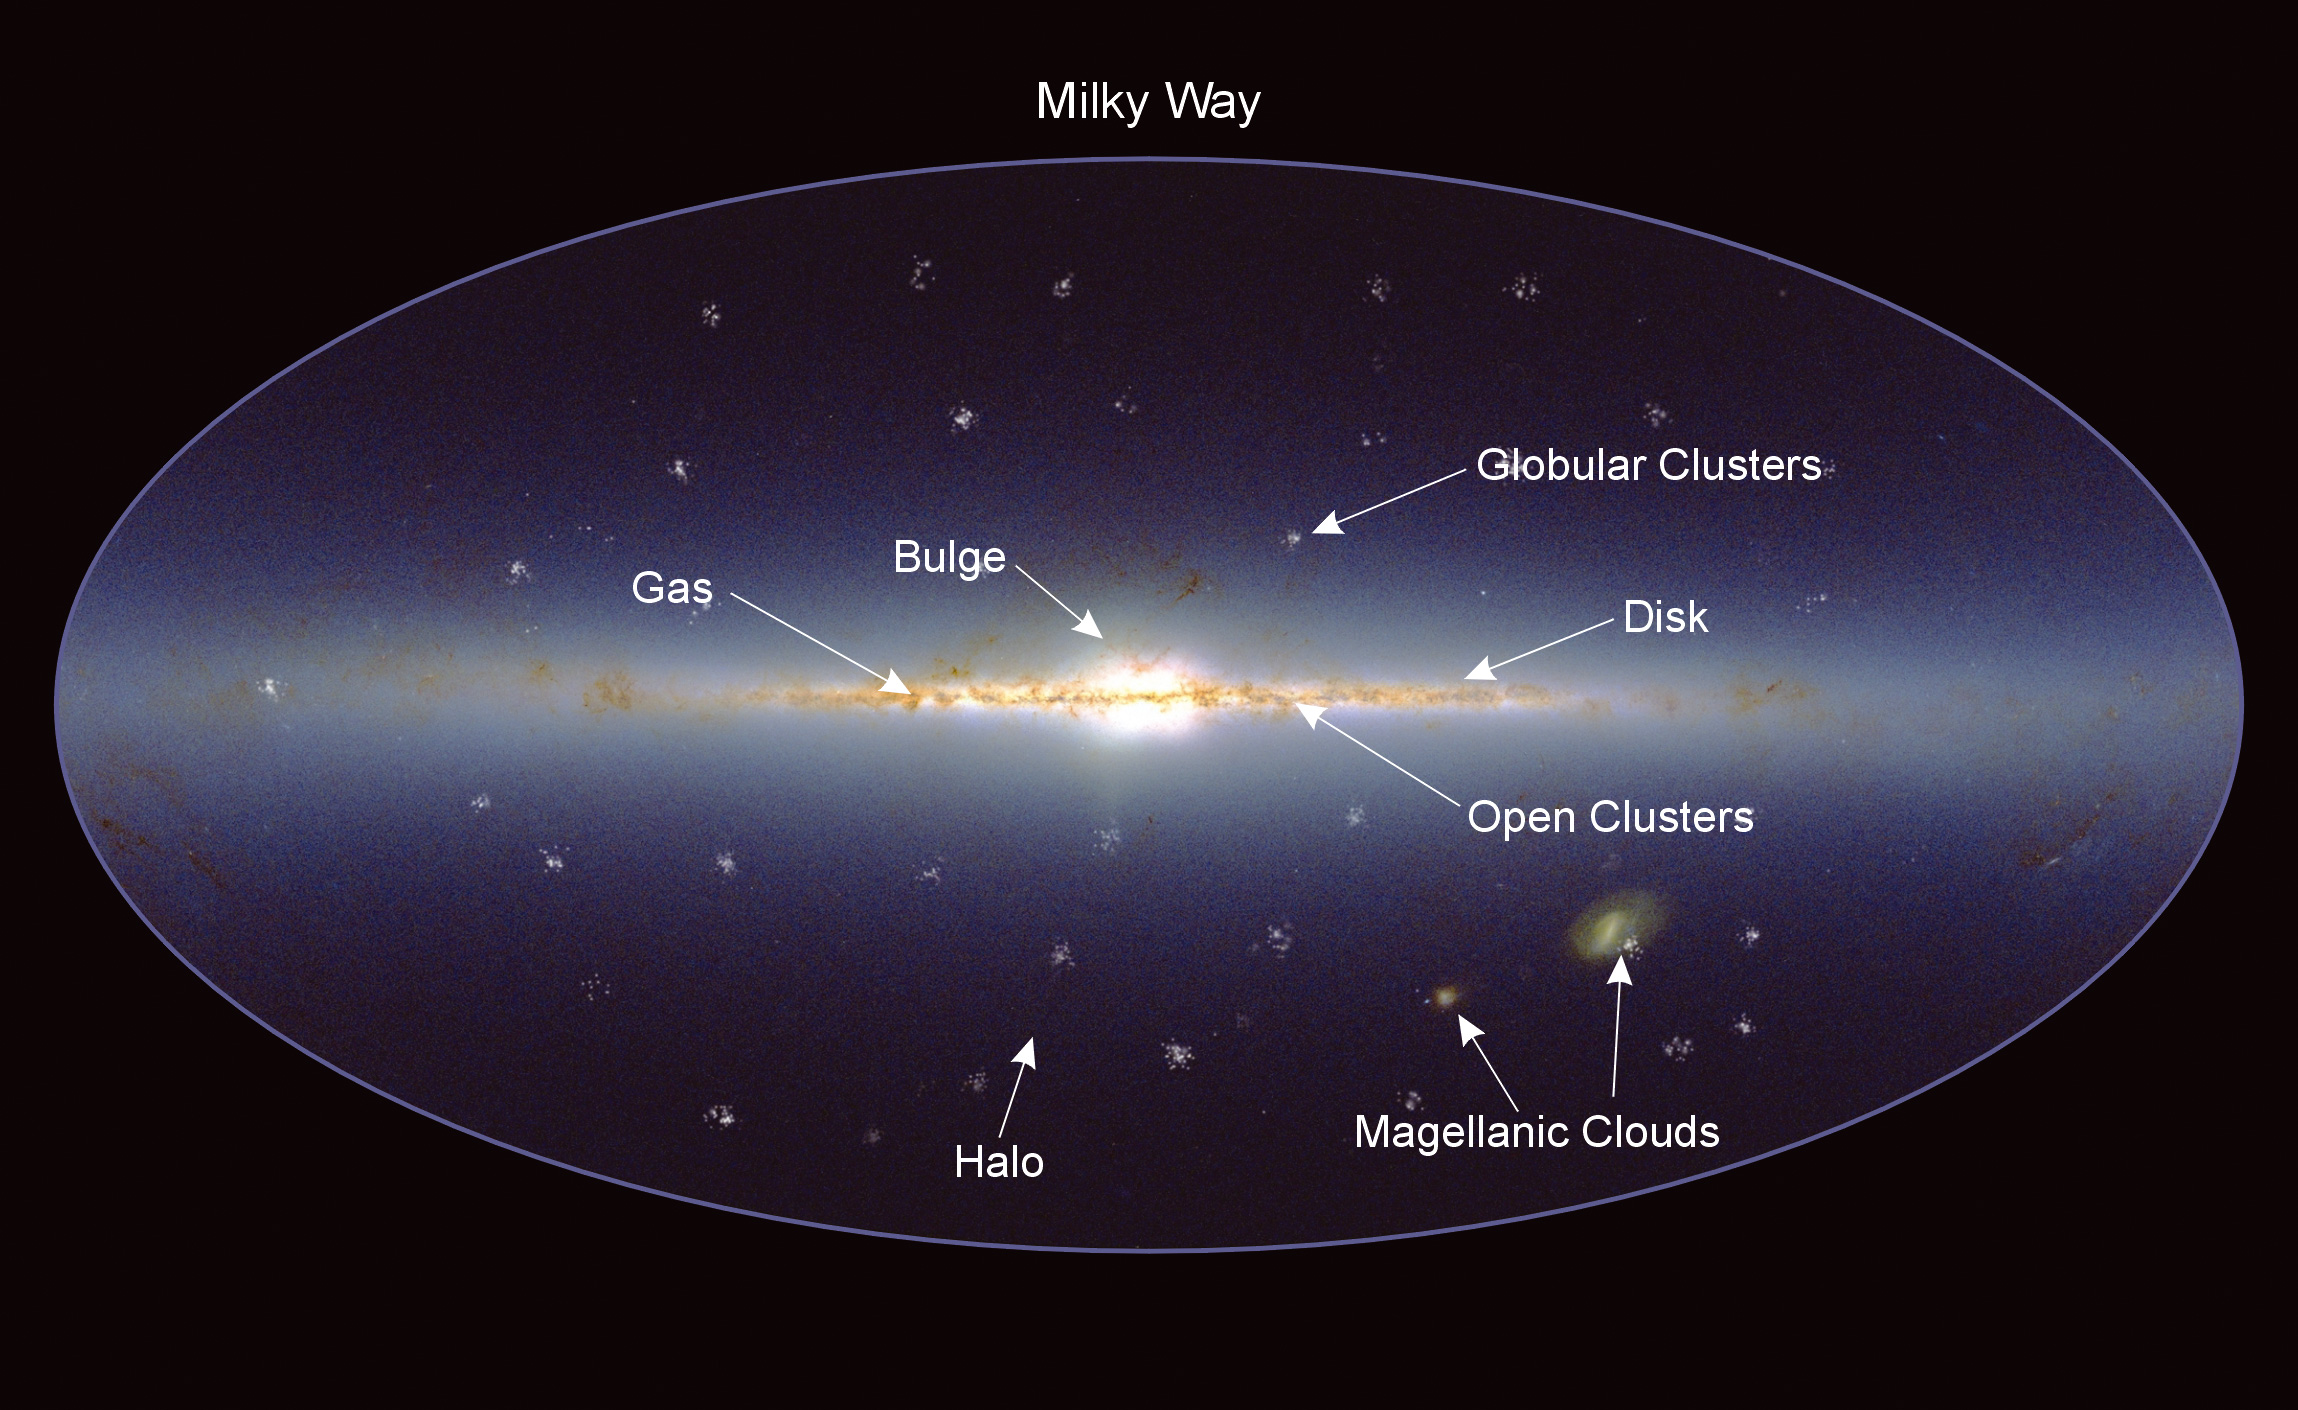 |
Figure 4: The Milky Way This illustration gives an overview of the Milky Way galaxy. The different components of this complicated system of stars, gas, and dust are marked. The plane of the disc lies along the central horizontal line. The globular clusters are distributed in a spherical halo around the galactic centre. It is believed that this distribution is related to the fact that these clusters of stars formed early on in the history of the Galaxy. |
forms an important part of the research interest of the international astronomical community. These clusters of stars are significant, not only as valuable test beds for theories of stellar structure and evolution, but also because they are among the few objects in the Galaxy for which relatively precise ages can be determined. Because of their extreme longevity they provide a very useful lower limit to the age of the Universe. The distribution of their ages and the correlation between the age of a cluster and its chemical abundance makes these systems an invaluable probe into the processes of galaxy formation.
All stars gathered in a globular cluster share a common history and differ from each other only in their mass. Therefore, globular clusters are ideal places to study the evolution of stars. In the following exercises, you will determine some properties of one particular globular cluster, Messier 12.
The globular cluster Messier 12 (or M12), also called NGC 6218, was discovered in 1764 by Charles Messier and thus became the 12th Messier object. Like many other globular clusters, Messier described it as a ĹNebula without starsĺ a consequence of the modest resolving power of his telescopes. William Herschel was the first to resolve the cluster into single stars in 1783.
M12 is located in the constellation of Ophiuchus and can be seen with binoculars from places with very low light pollution. The visible magnitude of the whole globular cluster is 6.7 (read about magnitudes in the Astronomical Toolkit, page 2) and the brightest star in the cluster has a visible magnitude of 12.
The NGC (New General Catalogue) was published in 1888. It lists open and globular star clusters, diffuse and planetary nebulae, supernova remnants, galaxies of all types and even some erroneous entries corresponding to no objects at all.
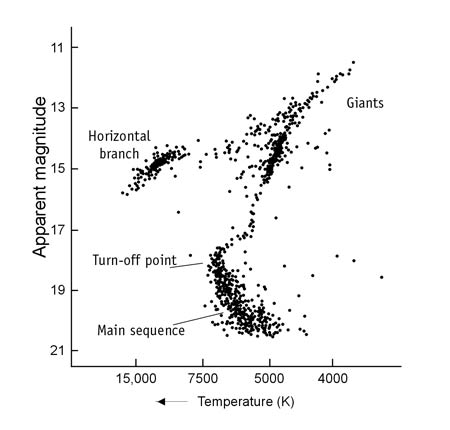
A graph showing luminosity L (or absolute magnitude M) against surface temperature T for stars is called a Hertzsprung-Russell diagram (short: H-R diagram). Fig. 6 shows a general example which has been constructed from observations of stars in nearby clusters where the distances are known (from HIPPARCOS measurements). The surface temperature of a star T can be derived from measured values of its colour (mB-mV) (see the Astronomical Toolkit).
It is clear from looking at the H-R diagram that the (L, T) measurements for different stars form a curious pattern when plotted on the diagram. The stars are concentrated in specific areas (marked in the figure). The H-R diagram holds the key to understanding how stars evolve with time. Different stars will ľ depending on their mass ľ move through the diagram along specific routes.
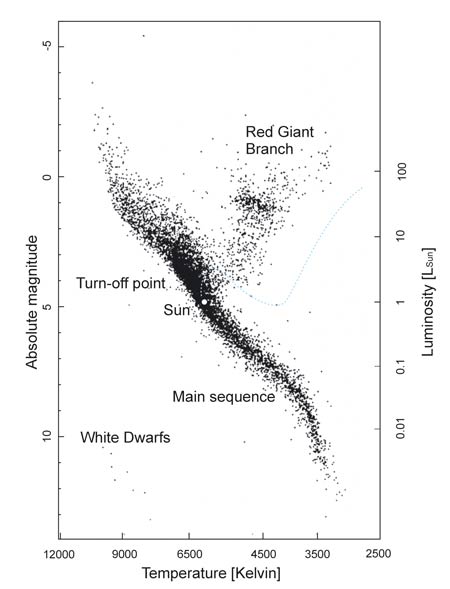
Stars spend most of their life on the Main Sequence, burning hydrogen slowly in a state of stable equilibrium. This is obviously why most stars are observed to lie on the Main Sequence, approximately a straight line from the upper left to the lower right in the diagram. When the hydrogen supply in the core of the star is depleted, hydrogen burning is no longer possible. This ends the main sequence phase of the starĺs life and the equilibrium of gas pressure and gravitational contraction in the stellar core is no longer stable. Hydrogen fusion now takes place in a surrounding shell while the core starts to shrink. As the core contracts the core pressure and the central temperature rise, so that helium nuclei in the core begin to fuse and form heavier elements. This cycle can be repeated using progressively heavier elements as each lighter element is exhausted in the core. During this phase the star appears as a red giant. Such stars appear on the H-R diagram off the main sequence line to the upper right. The higher central temperature causes the outer shells of the star to expand and cool down and thus the surface temperature falls. The whole star becomes very large and, because of the lower surface temperature, it mainly emits radiation of longer wavelengths out into space so the star looks red. Despite their low surface temperature T, all red giants have a high luminosity, L, because of their huge radius, R. This results from Stefan- Boltzmannĺs radiation law for blackbody radiation:

where sigma is the Stefan-Boltzmann constant. Typical values for red giants are R ~ 102 Rsun, T ~ (3..4)103 K , so L is about 103 Lsun.
When the advanced fusion processes in the stellar core can no longer be sustained, the core collapses again. Once again the temperature of the core increases and now the outer shells of the star are expelled. A so-called planetary nebula is formed from the remnants of the starĺs shell (see ESA/ESO Astronomy Exercise 3). The collapsed core is very hot (white) and the star is very small. Such a star is very suitably called a white dwarf and is the end of a normal sunlike starĺs life.
To make a rough estimate of the relationship between luminosity L and surface temperature T for all the main sequence stars, let us look at the H-R diagram (Fig. 6). The approximate straight line of the Main Sequence spans about one power of ten in temperature: (3 × 10³ ... 3 × 10⁴) K. The range of luminosities spans about six powers of ten: (10-2 ... 104) Lsun. We can therefore roughly estimate: L ∝ T6 (L prop T6) for the main sequence stars.
To give some examples:
A high mass star on the main sequence with a surface temperature of about Tstar = 1.0 Î 104 K has a luminosity of about Lstar = (10/5.8)6ĚLsun, or approximately 26 times the Sunĺs luminosity. (The Sunĺs luminosity has a standard value of 1 on the luminosity scale).
A low mass star with Tstar = 3.5 Î 103 K has a luminosity of only about 5% of the Sunĺs luminosity.
All the information we can extract from the stars is contained in the radiation that we receive from them. As explained in the Astronomical Toolkit, different filters and colour-systems can be used to measure the brightness of a star. In this exercise we use a B-image and a V-image. In your analysis of these images you will find the apparent mB and mV magnitudes of a sample of stars in the cluster. Then you can calculate the mB-mV values (the B-V colour index). Finally you will be able to determine the surface temperature of the stars (see Astronomical Toolkit).
A cluster is a group of stars. The life of a cluster is determined by the lives of the different types of stars within it. For a globular cluster, observations have shown that very little gas and dust remain, so new stars are rarely born in such a cluster. The stars we see in a globular cluster are all Ĺadultsĺ and have evolved in different ways depending on their mass.
Most low-mass stars are settled on the Main Sequence. This is because low mass stars are expending their energy very slowly. They burn their hydrogen reserves quietly and will continue doing so for billions of years. They will therefore stay on the Main Sequence for a long time.
On the contrary, the heavier stars in the cluster have already converted the hydrogen in their cores and become red giants. This all happened long ago, so today no high-mass, hot stars remain to fill the upper half of the Main Sequence (see Fig. 7). These stars are now located in the diagonal area that starts from the Main Sequence and reaches out towards the upper right of the diagram known as the Red Giant Branch.
The point where the Main Sequence and the Red Giant Branch meet is called the turn-off point and is an important clue to the age of the cluster. In the following exercise, you will measure the co-ordinates of this point on your diagram and determine the age of M12.